Use of process 1D
The module pyrixs.process1d deals with aligning and calibrating 1d spectra. Data are stored in Pandas dataframe spectra. Typical workflow involves determining the shifts required to align all the spectra, summing them to one ``spectrum’’ and then calibrating the energy loss x-axis.
The notebooks provide the easiest most straightforward access to these functions, but the pyrixs.process1d can also be used from the command line to provide the most flexibility and ease of automation.
Key Components
Load the required modules
In [1]: import matplotlib.pyplot as plt

In [2]: import pyrixs.process1d as p1d

ImportErrorTraceback (most recent call last)
<ipython-input-2-58fe6383c1e1> in <module>()
----> 1 import pyrixs.process1d as p1d

ImportError: No module named pyrixs.process1d
Load spectra and plot them
The function process1d.load_spectra loads a list of spectra in text files, which can be found process1d.get_all_spectra_names.
In [3]: search_path='../notebooks/test_data/*.txt'

In [4]: spectra = p1d.load_spectra(search_path, p1d.get_all_spectra_names(search_path))

NameErrorTraceback (most recent call last)
<ipython-input-4-308708955b47> in <module>()
----> 1 spectra = p1d.load_spectra(search_path, p1d.get_all_spectra_names(search_path))

NameError: name 'p1d' is not defined

In [5]: fig1, ax1 = plt.subplots()

In [6]: artists = p1d.plot_spectra(ax1, spectra)

NameErrorTraceback (most recent call last)
<ipython-input-6-58c4dae755fc> in <module>()
----> 1 artists = p1d.plot_spectra(ax1, spectra)

NameError: name 'p1d' is not defined
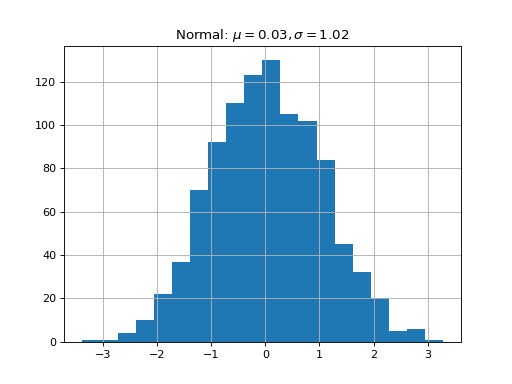
import matplotlib.pyplot as plt import pyrixs.process1d as p1d search_path=’../notebooks/test_data/*.txt’ spectra = p1d.load_spectra(search_path, p1d.get_all_spectra_names(search_path)) print(spectra) fig1, ax1 = plt.subplots() artists = p1d.plot_spectra(ax1, spectra) p1d.plt.show()
(Source code, png, hires.png, pdf)